
It can sometimes be useful to create a more visual representation of users training in reporting and a popular way of showing is this is with cross tables.
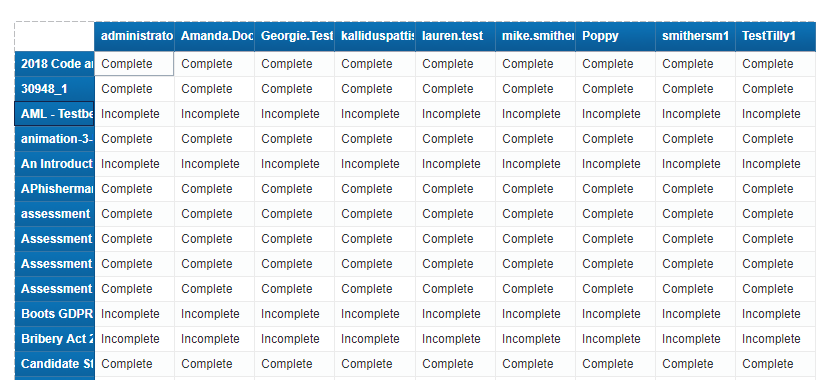
Example Cross Table - showing lessons, users and statuses:
To create a cross table:
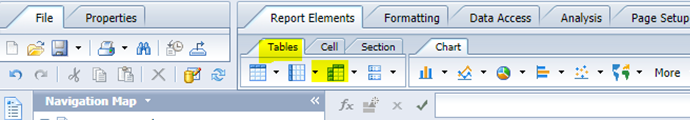
In design mode of your chosen report > select the cross table icon available via the Tables tab > click the drop down arrow > define Cross Table
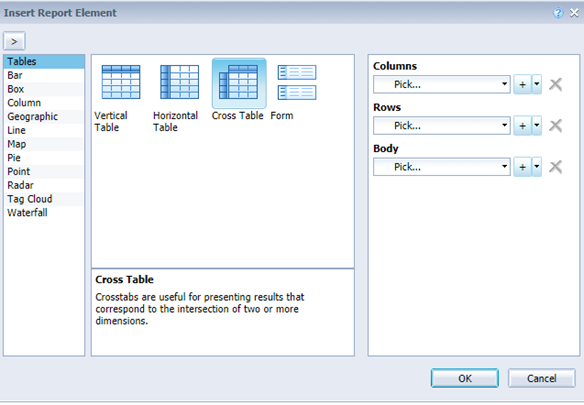
You then need to decide how you want to define the cross table and select what you would like to appear in the columns, rows and body sections, which you can select from the list of objects via the drop downs > Ok
It is important to note that the body of a cross table need to be calculated using a measure variable not a dimension.
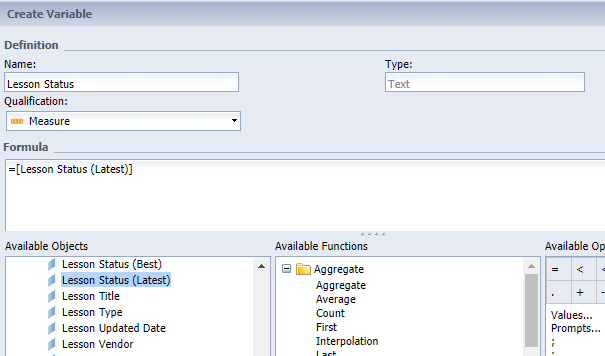
If you want to use an object such as ‘Lesson Status (Latest)’ (created by default as a dimension) as the body of the report then you need to make sure that the object is created as a measure.
To turn a dimension object into a measure, you can do this by creating a new variable by right clicking on the 'variables' folder included in the list of available objects > giving the variable a title > changing the qualification from a Dimension to a Measure > selecting a object and prefixing it with '=' in the formula section:
You can then add the new measure that has been created to the body of the cross table.