
As discussed in https://kallidus.zendesk.com/hc/en-us/articles/360018873958-Recruit-time-to-hire-diversity-etc-reports-in-one-click your Charting Dashboard gives you an instant calculation of time-to-hire reports covering up to 90 days.
For more detailed reporting, or for reports covering a longer period, you will need to use Analytics. Please note, you will need to export the data from Analytics and do some calculations in Excel.
First, identify what dates you are using to measure time-to-hire. These could be for example:
- the vacancy opening date through to the date candidates are moved into a 'hired' status
- the date a requisition was submitted through to the date candidates are moved into a 'hired' status
Also think about how you want to segment your data - for example, by location or department or other vacancy classification in your system.
Analytics
Click 'Analytics' from your Reports tab in Kallidus Recruit:

The new report creation page is available as soon as you click into Analytics. Now you can open up the various sections to add the information you need,
In the Candidate section, select Candidate ID and any other candidate information you want.

Candidate Folder History section
This section of Analytics contains 4 possible timestamps and 4 possible users for each candidate folder, for example, here are the options for the "Screening - New candidates" folder:

Why so many options?
There are 4 possible timestamps and 4 possible users for each folder(status) because candidates can be moved in and out of folders by different people (or automatically by the system). The options allow you to report on the first time and the last time a candidate was moved to a folder, and the first time and the last time a candidate was moved out of a folder.
For example, a candidate may have been moved to first interview - pending by recruiter A, then moved out of first interview pending by recruiter B. Later, on that same candidate might have been moved back to first interview - pending by recruiter B, then out again by recruiter A. Analytics lets you report on all this activity via the options available for each folder.
In the Candidate Folder history section, grab the timestamp which represents the hired date, such as 'Hired - date first entered' .
(n.b. depending on how you measure time-to-hire, you might prefer to use the candidate 'start date' from the 'Candidate' section above, or some other timestamp)

In the Vacancy section, check any information you need, such as Vacancy ID, Title, Opening date and any classifiers you might want to filter on such as location and department.

When you have selected all the information you need, hit 'Next'.
We only want to report on candidates where hiring has happened, so add a filter to the report to exclude candidates where they haven't entered the Hired folder:
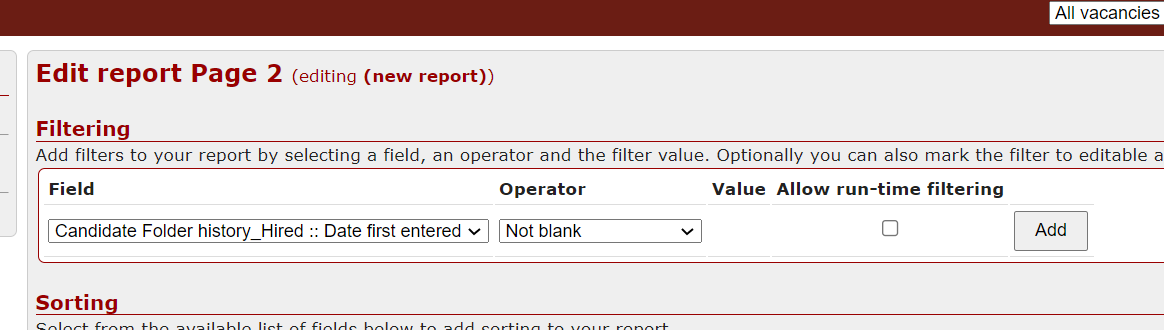
If you want to report on time-to-hire over a specific period, you could also do that using a filter, for example, instead of choosing 'Not blank' as in the example above, you could select a date range for when hires were made, or alternatively, add an additional filter to base your reporting period on a different date such as candidate submissions.
Arrange the fields in your preferred order, and give them a user-friendly name:

Now click 'Preview' to see what the first 10 rows of your data will look like. Click 'Edit report' to change anything, or click the Save icon.
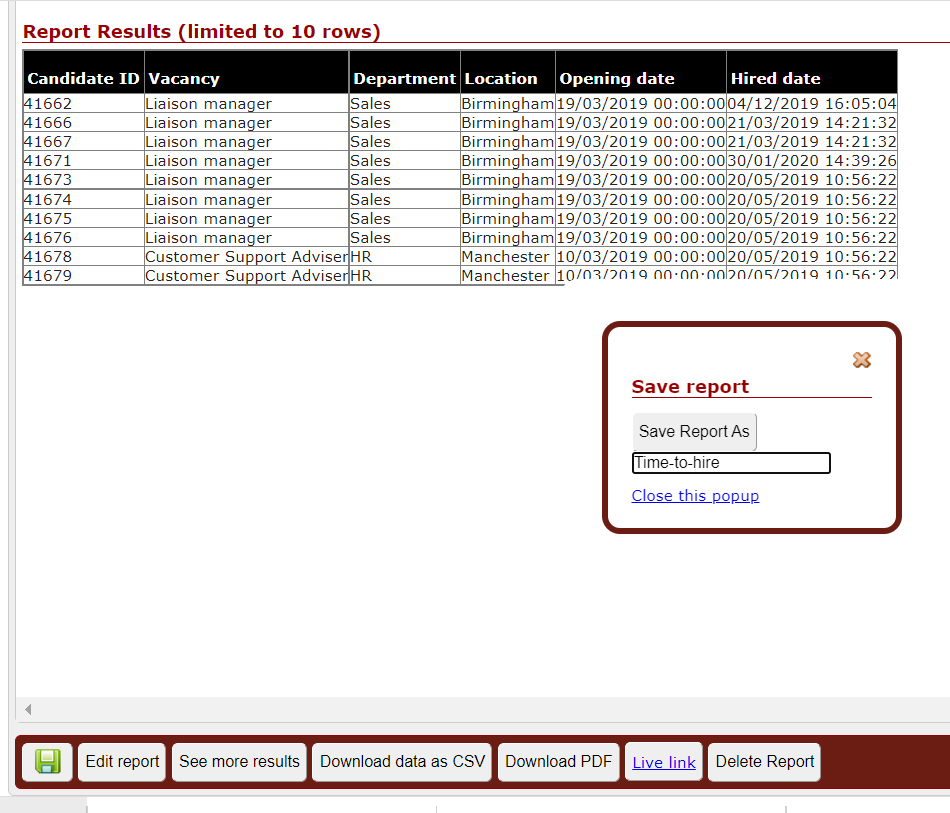
Click 'Download data as CSV' to grab all the data, and open the file in Excel. We need to add two columns:
Add 'Time to hire' and use a formula to subtract your vacancy opening date from your hired date. In the example below, the formula is simply =F2-E2 - this gives the time-to-hire in days for each candidate. Optionally format the cells in your Time to hire column to show only whole numbers (zero decimal places).
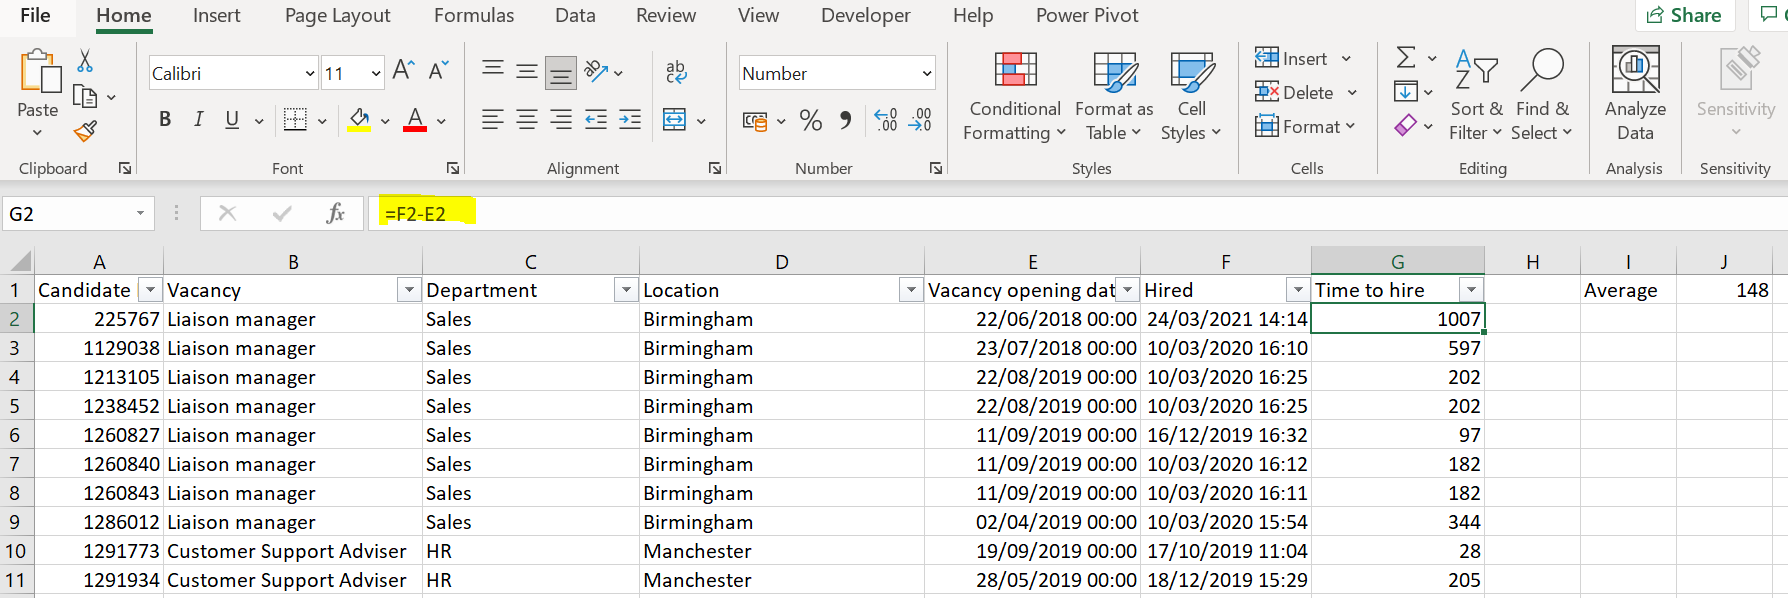
You're likely to want to see an average time-to-hire for your hires, which you can then filter on by department, location, or whatever other classification you use.
To achieve this, add a 'Subtotal' formula in a cell on your spreadsheet header row, referencing the Time to hire column (in the example above, column G) as follows: =SUBTOTAL(1,G:G). This calculation is in cell J1 in the example above.
This gives us the average of the time-to-hire calculation on filtered data in Excel, for example, by location - Bristol candidates take an average of 169 days to hire in this report:

You can now save your file as a spreadsheet to keep your calculations in place, and update the data by pasting over a fresh CSV file.
If you are a confident Excel user, you can live-link the data from Analytics into Excel. This enables you to update the report without having to download a fresh CSV every time. Please see the following articles for more information on how to do this:
https://kallidus.zendesk.com/hc/en-us/articles/360002175474-Recruit-Live-Linked-Excel-report